Social Media Analytics and Reporting: The Complete Guide (+ Free Client Report Template)
If you run social media for a living, you know the monthly ritual. Open every network's insights. Screenshot the good bits. Paste them into a slide deck. Explain to a client why one app says one thing and your report says another. Then do it all again next month, for every brand you manage.
We spent a long time rebuilding RobinReach Analytics & Reports to end that ritual, and along the way we learned a lot about why social media numbers are so messy. This guide is everything we learned:
- Why your numbers never match between apps
- What changed with Facebook views vs. impressions
- How to calculate engagement rate properly, on every platform
- How to find your real best time to post (hint: not from industry averages)
- What Google Business Profile insights actually mean
- How to build a client report people read, with a free template
You can do all of it by hand. At the end, we'll show how RobinReach does it for you.
Why social media numbers never add up
When a client asks "why does Instagram show something different?", the answer is almost always one of these:
- Different definitions. One tool counts engagement as likes and comments. Another adds shares, saves and clicks. Same post, different total.
- Time zones. A day in UTC isn't a day in New York. Posts near midnight land on different days, and weekly totals shift.
- Posts quietly left out. Some tools only total the posts that loaded, or skip posts whose numbers failed to refresh.
- Stale numbers. A post keeps collecting engagement for days. A report built from an early snapshot undercounts it.
- Retired metrics. Networks change what they measure. Facebook is the biggest recent example (more on that next).
The fix is boring, and it works. Total every post published in the period, use each post's latest numbers, report in the client's time zone, and state your definitions once at the top. That's exactly how we rebuilt the math in RobinReach: every total adds up all the posts you published in the period you pick, each with its latest numbers. Nothing quietly left out.
Facebook views vs. impressions: what changed
Meta has replaced impressions with views as the main way it measures how often Facebook content is seen. Instagram made the same switch first, and Facebook followed. Meta's stated goal is one distribution metric for all content types, calculated the same way on both apps (Social Media Today).
For anyone using a third-party tool, the big date was November 15, 2025. That's when Meta deprecated Page impressions, Post impressions and Page fans in its Page Insights API (Emplifi). Every analytics tool had to switch.
- Page impressions became Page views
- Post impressions became Post views
- Page fans (likes) became Page followers
What this means for your reports
- Your Facebook numbers may look higher. Views count repeat views by the same person, so totals can come out above the old impressions figures (Whatagraph). That's not a growth spurt. Tell clients before they ask.
- Year-over-year comparisons break. Comparing this year's views with last year's impressions isn't apples to apples. Add a note to any report that spans the change.
- Old reports stop working. Dashboards and templates built on impressions return errors or blanks. Remap them to views.
- Use views as the denominator when you calculate engagement rate on Facebook (see the next section).
RobinReach's Facebook reports now show views, the number Meta itself uses. If your numbers look higher than they used to, that's why.
How to calculate engagement rate
Engagement rate is engagements divided by the number of people who saw the post, times 100. The catch is that tools divide by different things, which is half the reason reports disagree.
\text{Engagement rate} = \frac{\text{likes} + \text{comments} + \text{shares} + \text{saves}}{\text{reach}} \times 100Say an Instagram post got 246 engagements, reached 6,000 accounts, got 7,500 views, and the account has 10,000 followers:
- By reach: 246 / 6,000 × 100 = 4.1%. The best default whenever the network reports reach.
- By views: 246 / 7,500 × 100 = 3.28%. For video, or networks that report views instead of reach.
- By followers: 246 / 10,000 × 100 = 2.46%. Only when reach and views aren't available.
Same post, three answers. Pick one, write it in the report, and never switch mid-year. Follower-based rates break on posts that travel beyond your followers; a viral TikTok can show over 100%.
For a whole month, pool it
Don't average each post's rate. Add up all engagements, add up all reach, and divide once. If Post A got 50 engagements from 500 reach (10%) and Post B got 300 from 10,000 (3%), the average says 6.5%, but the pooled rate is 3.33%. The average lets one small post inflate the whole month.
Engagement rate by platform
- Instagram: likes, comments, shares and saves, divided by reach.
- Facebook: reactions, comments and shares, divided by views.
- TikTok: likes, comments, shares and saves, divided by views.
- YouTube: likes, comments and shares, divided by views.
- LinkedIn Pages: reactions, comments, reposts and clicks, divided by impressions.
- X: likes, reposts, replies, quotes and bookmarks, divided by impressions.
- Threads: likes, replies, reposts and quotes, divided by views.
- Pinterest: saves, pin clicks and outbound clicks, divided by impressions.
- Bluesky: likes, reposts, replies and quotes, divided by followers.
- Mastodon: favourites, boosts and replies, divided by followers.
Bluesky and Mastodon don't show how many people saw a post, so followers is the only option there. Compare those networks with themselves, not with Instagram.
What's a good engagement rate?
Better than yours was last quarter. Published benchmarks use different formulas, industries and account sizes, and smaller accounts almost always score higher. Track your own rate over time, per network, with the same formula. If it's climbing, your content is working.
The metrics that matter (and comparing them properly)
You don't need 40 metrics. You need five to seven, defined the same way every month:
- Engagement and engagement rate: did people care?
- Reach or views: how far did it travel?
- Follower growth: net new followers, not the total.
- Posts published: explains many ups and downs on its own.
- One action metric: link clicks, calls or bookings, whatever is closest to the client's revenue.
Always compare with the previous period
"12,400 engagements" means nothing. "12,400, up 27% from 9,800" is a story. Compare each period with the period of the same length right before it: 30 days against the previous 30, a week against the week before.
Find the why behind every spike
A jump in engagement is usually two or three posts doing most of the work. Find them and say what they had in common: format, topic, hook or timing.
Then look at the engagement mix, the split between likes, comments, shares and saves. Saves and shares usually signal more value than likes. If shares drop by half while likes hold steady, you want to know before your client asks.
Best time to post: why industry averages are wrong
Most "best time to post" charts pool data from thousands of accounts and publish the hours where engagement was highest on average. That's a starting guess, not an answer, for a few reasons:
- Your audience isn't average. A coffee shop's followers scroll at 7am. A B2B brand's followers scroll at their desks. Blend them and you get a time that suits neither.
- Time zones get flattened. "Tuesday at 10am" rarely says whose 10am.
- It's a loop. Brands post on weekday mornings because the charts said so, so those slots collect the most data and look best.
- Totals hide the winner. Post five times on Tuesday and once on Sunday, and Tuesday wins on total engagement even if Sunday's post did better.
Does timing still matter on algorithmic feeds?
Yes, but less than the content. Feeds rank posts by predicted interest, so a strong post can find an audience days later. Timing still shapes the first hours, when your followers see it and their reaction helps decide how far it goes. Stories, X's Following feed, Bluesky and Mastodon still lean on recency. Think of timing as a multiplier: it helps a good post, it won't save a weak one.
How to find your own best time to post
- Pull 60 to 90 days of posts, one network at a time.
- Convert every post to your audience's time zone, not your laptop's.
- Group posts into weekday and three-hour blocks. That's 56 slots, easy to read as a heatmap.
- Score each slot by engagement rate per post, not total engagement.
- Mark slots with only one or two posts as untested, not as bad.
- Test. For four weeks, post similar content in your two best slots and two untested ones. Keep the winners, and repeat every quarter.
Google Business Profile insights explained
For local businesses, Google Business Profile often matters more than any social network. It's where people decide to call, visit or book. Google's Performance report shows how people find the profile on Search and Maps and what they do next (Google Help).
- Views: people who viewed your profile on Google Search and Maps, split by device.
- Search queries: the searches your profile showed up for.
- Calls: taps on the call button in your profile.
- Website clicks: clicks on the website link in your profile.
- Directions: people who asked for directions to your business.
- Interactions: all actions combined, including calls, messages, bookings, directions and website clicks.
Only metrics that apply to a business appear, so a restaurant may see menu or order metrics that a plumber won't.
Gotchas worth knowing
- Calls only count taps on the button. Someone who copies your number and dials it won't show up (Search Engine Land).
- Views count profiles, not search appearances. Your profile can show up in results far more often than it gets viewed.
- Ads are included. Performance data mixes organic and Google Ads activity, so a paid campaign can lift these numbers.
- Data arrives late. Recent days can take a few days to fill in. Don't report on yesterday.
What to report for local clients
Put calls, website clicks and direction requests first, per location. These are the closest thing social reporting has to revenue numbers. A client may shrug at a 5% engagement bump. They won't shrug at 40 more calls this month.
How to create a social media report for clients
A good client report answers three questions in under two pages: what happened, why it happened, and what you'll do next. Most stop at the first one, which is why clients skim them.
- Agree on the goal first. Awareness, leads, store visits and community need different numbers. Write the goal at the top.
- Pick five to seven metrics and define them once, including your engagement rate formula.
- Compare with the previous period for every number.
- Use complete, current data: every post in the period, latest numbers, client's time zone.
- Explain the why with the top three posts and the engagement mix.
- End with one or two actions. "Test two carousels a week on Tuesday mornings" beats "post more video".
- Brand it and send it on the same day every month. Consistency builds more trust than any chart.
Free social media report template
Copy this, swap in your numbers, and you have a report in under an hour.
[Client] Social Media Report: [Month Year]
Prepared by [Your agency]

GOAL THIS QUARTER
More calls and bookings from Instagram and Google.

1. SUMMARY
Engagement rose 27% on the back of three Reels. Follower growth slowed.
Next month we're testing carousels on Tuesday mornings.

2. HEADLINE NUMBERS (vs. last month)
Engagement:        12,400   (+27%)
Engagement rate:   4.1%     (+0.6 pts)
Reach / views:     148,000  (+18%)
Follower growth:   +320     (-12%)
Posts published:   22       (+4)
Link clicks:       610      (+9%)

3. TOP 3 POSTS AND WHY THEY WORKED
- [link] Behind-the-scenes Reel. Strong hook in the first second.
- [link] Customer story carousel. Most saves of the month.
- [link] Weekend offer. Most link clicks.

4. ENGAGEMENT MIX
Likes 71% | Comments 9% | Shares 8% | Saves 12%
Saves up 40%. Educational posts are landing.

5. GOOGLE BUSINESS PROFILE (local clients)
Calls 142 (+18%) | Website clicks 96 (+5%) | Directions 210 (+22%)

6. PROFILE COMPARISON
Instagram carried the month. LinkedIn flat.

7. NEXT MONTH
- Two carousels a week, Tuesday 9am to noon.
- Repost the top Reel to TikTok to test the audience there.
How RobinReach Analytics & Reports does all of this for you
Everything above works by hand. We did it that way for years, and that's exactly why we rebuilt RobinReach Analytics & Reports from scratch.
- Totals that add up. Every post published in the period, each with its latest numbers. Facebook shows views, the number Meta itself uses.
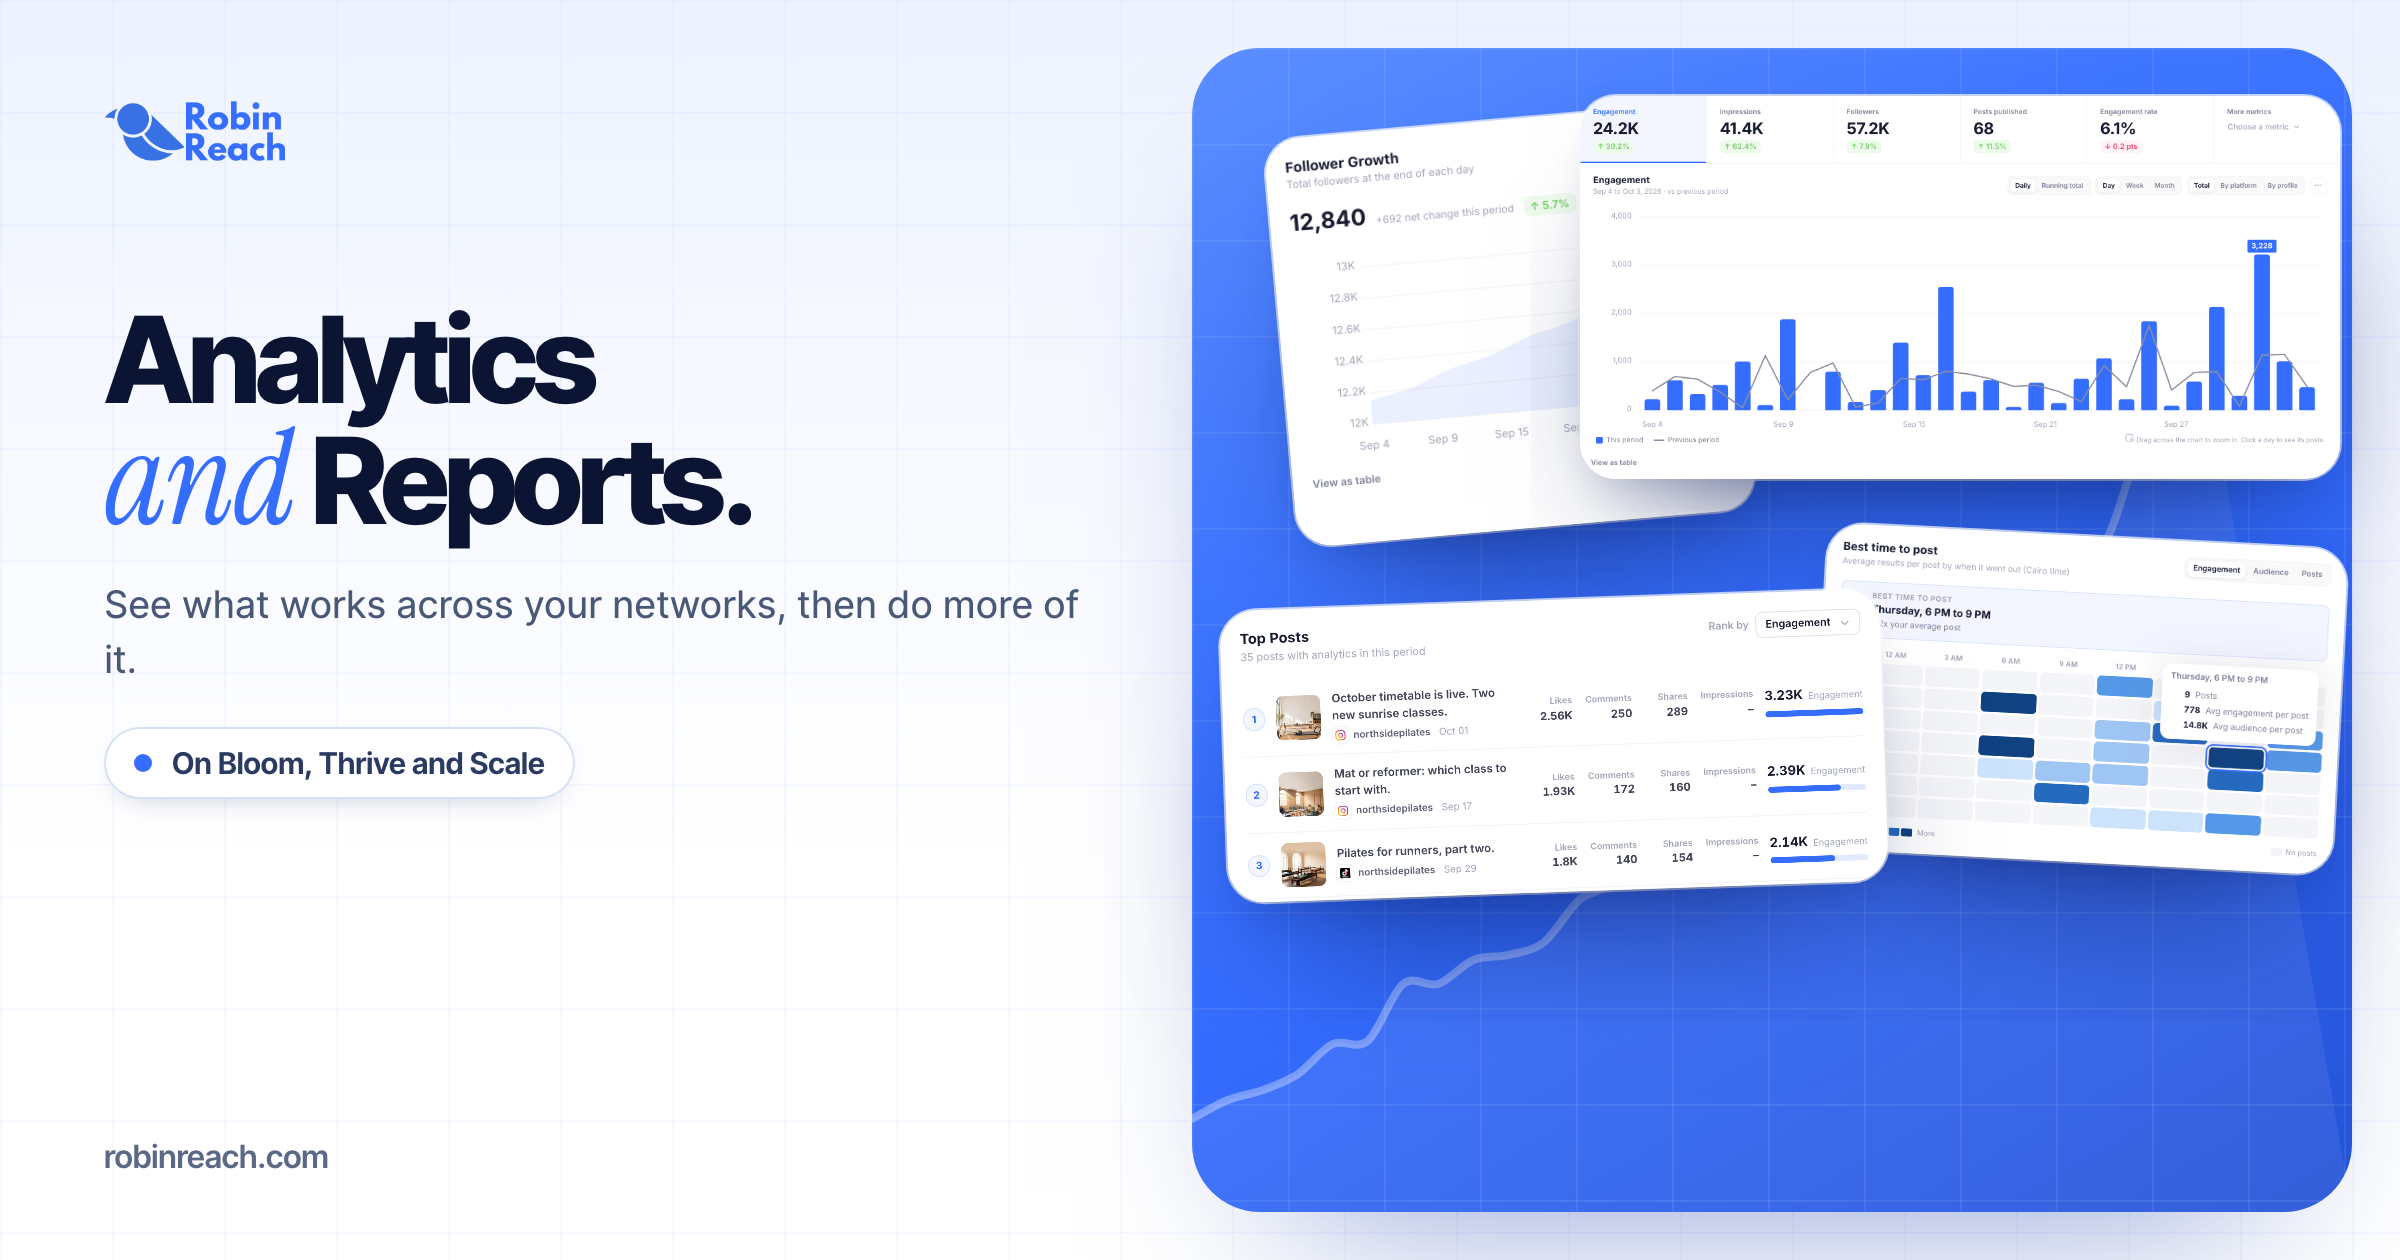
- One chart, previous period behind it. Pick 7, 30 or 90 days, or a preset like last month. See engagement, impressions, followers, posts published and engagement rate by day, week or month. Click a day to see the posts behind it, drag to zoom, or view any chart as a table or save it as an image.
- Best time to post from your own posts. A heatmap of every weekday in three-hour blocks, in your brand's time zone. Switch between engagement, audience and number of posts to spot the times you haven't tried.
- Top posts and engagement mix. Rank posts by engagement or a single number like comments, each linked to the live post. See how likes, comments, shares and saves changed.
- Compare profiles and brands. Profiles side by side, plus an All brands page showing which clients are growing and which need attention.
- Reports that send themselves. Branded PDFs with your logo, accent color and a "Prepared by" line. CSV downloads. Weekly or monthly emails with the PDF attached, at the hour you choose in your brand's time zone.
- Google Business Profile. Views on Search and Maps, calls, website clicks and direction requests for every location. The first read pulls in a whole year, so your charts are full from day one.
- Just ask Claude or ChatGPT. Connect RobinReach and ask "how did this week go compared with last week?" to get a plain answer with the numbers behind it.
11 networks: Instagram, Facebook, TikTok, YouTube, LinkedIn Pages, X, Threads, Pinterest, Bluesky, Mastodon and Google Business Profile.
What it doesn't do
We'd rather tell you now. RobinReach doesn't show audience demographics like age, gender or location, and doesn't compare you with competitors. LinkedIn personal profiles aren't covered, because LinkedIn doesn't share their post numbers. Post numbers cover posts you publish through RobinReach. Follower counts cover the whole account.
Which plans include it
- Free: live totals for each connected profile.
- Bloom: full reports for the last 92 days, best time to post, PDF and CSV exports, emailed reports, and X follower counts and growth.
- Thrive: everything in Bloom for the last 183 days, with more scheduled reports and exports.
- Scale: any dates up to a year at a time, 90 days of posts imported from before you connected, new posts refreshed every 6 hours during their first 12 hours, X post numbers, and PDFs and emails without RobinReach branding.
Compare plans for full details.
FAQ
What should a social media report include?
The client's goal, five to seven headline metrics compared with the previous period, the top posts and why they worked, the engagement mix, a profile comparison, and one or two actions for next month.
How do you calculate engagement rate?
Engagements divided by reach, times 100. Divide by views where a network doesn't report reach, and by followers only when nothing else is available.
Why are my Facebook numbers higher than before?
Meta replaced impressions with views, which count repeat views by the same person. Totals can look higher than old impressions reports, even if performance didn't change.
What is the best time to post on social media?
The one your own posts reveal. Group 60 to 90 days of posts into weekday and three-hour blocks in your audience's time zone, and compare engagement rate per post.
What do Google Business Profile insights show?
Views on Search and Maps, the searches your profile appeared for, and actions like calls, website clicks, direction requests, messages and bookings.
How often should I send clients a social media report?
Monthly for most retainers. Weekly during launches, paid campaigns, or the first month with a new client.
Get started
Already using RobinReach? There's nothing to set up and nothing to reconnect. Open Reports in the sidebar and your numbers are already there. Want the full tour first? The step-by-step Reports guide walks through every feature in 18 short chapters, and there's a video walkthrough on YouTube.
New to RobinReach? Start for free and see your own numbers today.
We built this for everyone who has to explain the numbers every month. We hope it makes that part of the job a lot shorter.