Link in Bio Analytics: See What Happens After Someone Taps Your Link
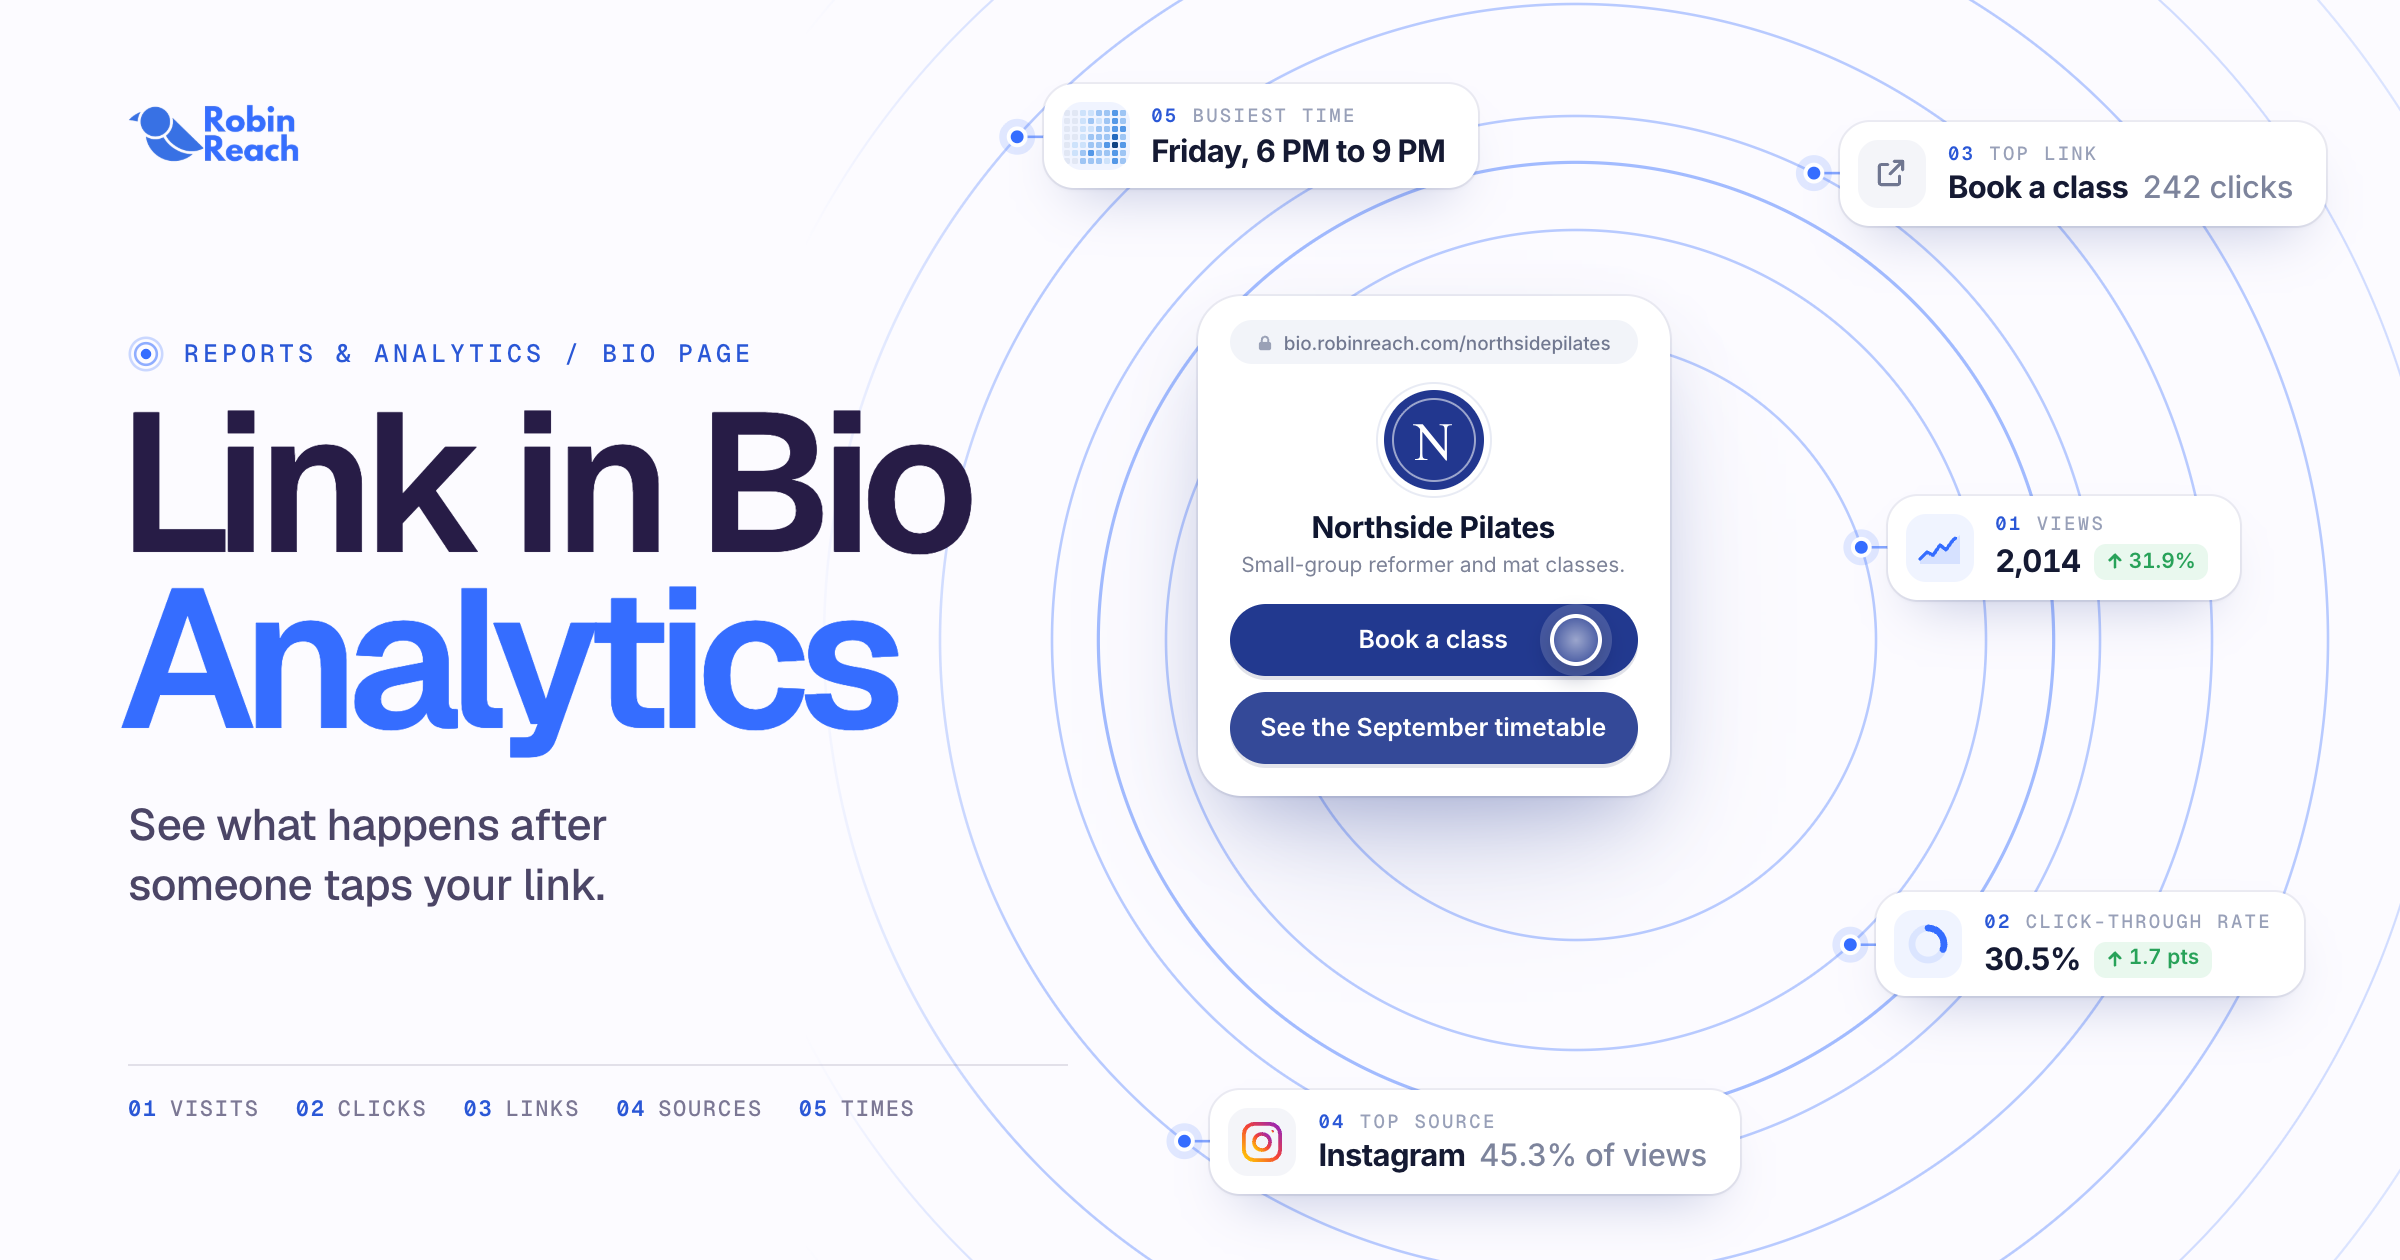
You put one link in every bio. What happens next?
You add your link to Instagram, TikTok and YouTube, mention it in captions, and point people to it in stories. Then it goes quiet. You have no idea how many people tapped it, which links they picked, or if they left without clicking anything.
The new Bio Page report fixes that. It lives in Reports & Analytics, right next to the rest of your social stats, so you can see what your link in bio actually does without opening another tool.
To make it concrete, we'll follow one example brand through the whole report: Northside Pilates, a small studio whose Bio Page has one job. Get people to tap "Book a class."
Is your Bio Page working?
Start at the top of the report. Five numbers tell you if people show up and if they do anything once they're there. Each one is compared with the period before, so you know right away if things are going up or down.
- Views: how many times your page was opened. Every plan.
- Clicks: how many times someone tapped a link. Every plan.
- Click-through rate: clicks as a share of views. Every plan.
- Visitors: how many people came, counted once per day. Sprout and up.
- Visitors who didn't click: people who looked and left, also known as bounce rate. Sprout and up.
Click-through rate is the one to watch. Views go up when you post more. Click-through rate only goes up when the page itself gets better.
Say Northside Pilates sees views climb after a busy week of Reels, but click-through rate drops. More people are landing on the page, and a smaller share of them care about what's on it. That's a sign to look at the links, which is the next section.
Do this: check click-through rate against last period before anything else.
Which links get clicked, and which are dead weight?
Top links ranks every link on your page by its share of clicks. Each one has its own trend chart, so you can see if a link is gaining or fading, not just where it stands today.
Below that is a separate list of links nobody clicked during the period. This is usually the most useful part of the whole report. Every link on a Bio Page competes for attention, and a link nobody taps is making the others harder to find.
Northside Pilates might find that "Book a class" gets most of the clicks, while "Read our blog" and "Meet the instructors" got none all month. Those two are just pushing the booking button further down the screen.
Do this: for each link nobody clicked, pick one:
- Move it higher, if it matters and people just aren't seeing it.
- Rename it, if the label is vague. "Book a class" beats "Schedule."
- Remove or swap it, if nobody needs it.
Where do your visitors come from, and who are they?
The sources view shows which apps and sites send people to your page. Instagram, TikTok, Facebook, X, YouTube, Snapchat, Google and Linktree are listed by name. Any other website shows up under its own name too, so a mention in a newsletter or a local blog won't get lost in a generic "other" bucket.
Some apps don't pass along where a visit came from. Those visits are counted as direct. So if direct looks high, it's usually people tapping your link inside an app, not people typing your URL.
You'll also see devices and top countries. Most link in bio traffic is mobile, so this mostly confirms it. Countries are more interesting. If Northside Pilates sees a chunk of visitors from another country, that's people who can't come to class. Maybe that's an online class waiting to happen, or maybe a post went somewhere unexpected.
Do this: find your top source and put more effort there for a few weeks. Then check if a smaller source is growing, because that's often where the next easy win is.
When should you share your link?
The visit times heatmap shows when people land on your page, by weekday and time of day, in your own time zone. The report also calls out your single busiest time, so you don't have to squint at the grid.
One thing to keep in mind: the heatmap partly reflects when you already post. If Northside Pilates always shares its link on Monday mornings, Monday mornings will look busy. That doesn't mean Thursday evening wouldn't be busier.
Do this: share your link just before your busiest time. Then, once a month, try a quieter slot for a week and compare. If the new slot holds up, you've found time you weren't using.
Dig deeper when you need to
When the summary isn't enough, the charts let you go further:
- Switch between day, week and month views.
- Drag across a chart to zoom into a specific stretch, like the week a post took off.
- Split a chart by source or device to see what's driving a spike.
- Download any chart as a PNG for a slide, or as a CSV if you want the raw numbers.
See the full Reports guide for everything else in Reports & Analytics.
Or just ask Claude or ChatGPT
Don't feel like opening the report? Once you've connected RobinReach to Claude or ChatGPT, you can ask in plain words:
- "Which link on my Bio Page gets the most clicks?"
- "Where did most of my Bio Page visitors come from this month?"
- "Did my click-through rate go up or down?"
It looks at the last 30 days of your Bio Page data. Handy when you're already planning content in a chat and want a quick number without switching tabs.
Moving from Linktree?
You don't have to switch everything in one day. If your old Linktree links to your RobinReach Bio Page, those visits show up in your sources as Linktree.
That gives you a simple way to know when it's safe to let go. Update the link in your main bios first, then watch the Linktree number. When it drops close to zero, the old page isn't doing anything for you anymore.
Comparing the two? See our Linktree alternatives page.
What's included, and what isn't
The Bio Page is free on every plan. Here's what each plan adds to the report:
- Every plan: the Bio Page itself, plus views, clicks and click-through rate.
- Sprout and up: everything above, plus visitors, visitors who didn't click, top links, links nobody clicked, sources, visit times, devices and countries.
- Bloom and up: everything above, plus asking Claude or ChatGPT about your Bio Page.
A few things worth knowing so the numbers make sense:
- Visitors are counted once per day. Someone who visits on three different days counts as three visitors that week. That's why we call them visitors, not unique visitors.
- Embedded videos and music don't count as clicks. They play right on your page, so nobody leaves it.
- Some visits show as direct. A few apps don't say where a visit came from.
- Bot visits are left out, so your numbers reflect real people.
- No cookies. Your Bio Page doesn't set any.
- Not in scheduled reports. Bio Page stats aren't part of scheduled email reports or client reports. For now, download the charts as PNG or CSV to share them.
Your 30-second weekly checkup
Open the report once a week and run through this:
- Is click-through rate up or down from last period?
- Any links nobody clicked? Move, rename or remove them.
- What's your top source this week? Did it change?
- When is your busiest time? Schedule your next link share just before it.
That's it. Small changes every week add up faster than a big redesign once a year.
FAQ
Is the Bio Page free? Yes. The Bio Page is free on every plan, and every plan includes views, clicks and click-through rate.
Can I see which links on my link in bio get clicked? Yes. Top links shows each link's share of clicks with its own trend chart, and a separate list shows links nobody clicked. This is on Sprout and up.
Can I see where my link in bio traffic comes from? Yes, on Sprout and up. Major networks like Instagram, TikTok and YouTube are listed by name, and other websites show under their own name.
Are bots counted? No. Bot visits are left out of your numbers.
Does the Bio Page use cookies? No. The page doesn't set any cookies.
Why do some visits show as direct? Some apps don't say where a visit came from, so those visits are counted as direct.
Do video plays count as clicks? No. Embedded videos and music play on the page itself, so they aren't counted as clicks.
Which plan do I need? Views, clicks and click-through rate are on every plan. Visitors, top links, sources, visit times, devices and countries are on Sprout and up. Asking Claude or ChatGPT is on Bloom and up.
Get started
Already have a Bio Page? Open Reports & Analytics and pick Bio Page. Your numbers are waiting.
Don't have one yet? It takes a few minutes, it's free on every plan, and it sits right next to the posts you already schedule in RobinReach.
Prefer to watch? We walk through the report on our YouTube channel. For the bigger picture of what you can track, see RobinReach analytics.